|
- Rice 60k Microarray
-
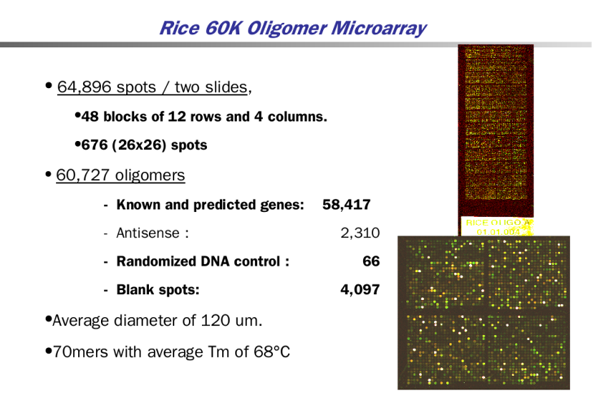
Expression profiling was conducted with the 60K Rice Whole Genome Microarray. The 60K
microarray was designed to represent all of the genes in rice. In total,
60,727 oligomers were designed from gene-specific regions of both japonica
and indica subspecies. These include 58,417 from known and predicted genes
and 66 randomized DNA oligomers. Among these, 2310 genes were also designed
as antisense oligomers. Oligomer sequences were extracted by Qiagen-Operon
based on rice genome information from the Beijing Genomics Institute.
Oligomers were synthesized and purified by Qiagen-Operon and spotted on
SuperAmine slides using the facilities of David Galbraith at the University of Arizona
(http://ag.arizona.edu/microarray/deconvolution.html). A set of two slides
of the 60K microarray has 64,896 spot addresses. Each slide is formatted
with 48 (12x4) blocks composed of spots (4099) were also included for easy
scanning alignment. Each oligomer 70 nucleotides long and with an average
Tm of 78 °C was printed in each spot address with a diameter of 100 um.
-
Noncorrelation of signal and background intensities was confirmed by plotting base 2 log
background intensity on the x axis and base 2 log intensity subtracted from
background intensity on the y axis. Before normalization, the normal
distribution and linear relations of Cy3 and Cy5 intensities were tested by
qqplot and a linear regression model, respectively, in R statistical
language. The spatial effects on the chip during the hybridization process
were checked with spatial.func in the sma package. The variance differences
between Cy3 and Cy5 intensities within the microarray were tested with the
t test under the assumption of both uniform and nonuniform variances. One-
and two-way analyses of variance of the signal intensity differences
between microarrays were performed. Median pixel intensities were
transformed as log ratios with base 2 and then adjusted by block-by-block
Lowess normalization for each slide (Yang et al., 2002). To improve the
speci~Acity of our statistical hypothesis in low-intensity regions, we
adopted the following empirical criteria: a spot was selected if it was not
flagged for its morphology, the diameter was larger than 51 pixels, and the
inn tensities of both signals were higher than 500. Multivariate
statistical tests such as clustering, principal component analysis, and
multidimensional scaling were performed with Acuity 3.1 (Axon Instruments).
-
Genes on microarray
|